DBSCAN is a spatial clustering algorithm that works by grouping data points together based on the density of the cluster. It can detect data noise and handle arbitrarily shaped and sized clusters.
DBSCAN is an alternative to k-means clustering and can be used in situations where k-means cannot be applied, or where it has difficulty finding a good epsilon value.
DBSCAN requires two parameters to work properly: epsilon and minimum points (minPts). Epsilon defines the circle’s radius around a point, while minPts is the number of points within this radius that qualify as core points.
Epsilon
Epsilon is the distance threshold that DBSCAN uses to indicate cluster boundaries. This is a non-linear threshold and can vary depending on the data set.
The epsilon parameter is determined by plotting the k-distance graph between points and their k = MinPts-1 nearest neighbors, ordering from largest to smallest values. The best values of Epsilon are where this plot shows an “elbow”, which indicates that the clusters are stable over this threshold.
Min Points
The parameter, minPts, is used to determine the minimum density around a core point. Larger values are better when there is noise and will yield more significant clusters.
Algorithm process
DBSCAN starts by randomly selecting a point from the dataset and then checks whether it is a core point. A point is considered core if it contains at least minPts points within its epsilon neighborhood.
Next, it searches for connected components of all the core points within its epsilon radius and ignores non-core points. If it finds one, it assigns it to a nearby cluster if it has an epsilon neighbor.If it doesn’t, it marks it as a noise point.
Outlier Points
An outlier point is a data point that is different from the rest of the dataset. It is different because it has extreme values compared to the rest of the dataset.
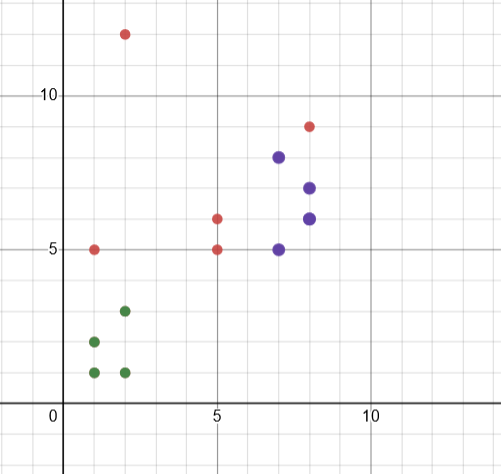
The following example uses DBSCAN to cluster 14 points
<?php require_once __DIR__ . '\vendor\autoload.php'; use Phpml\Clustering\DBSCAN; $samples = [[1, 2], [8, 7], [8,6], [7, 8],[2, 1], [2, 3], [8, 9],[1,5],[1, 1], [8, 6], [7, 5], [5,5], [2,12], [5, 6]]; $dbscan = new DBSCAN($epsilon = 2, $minSamples = 4); $dbscan->cluster($samples); $results=$dbscan->cluster($samples); $cluster=0; $piointID=0; foreach ($results as $re) { $cluster++; echo "Cluster $cluster: "; foreach ($re as $va){ $piointID++; echo "pioint $piointID: "; echo "("; foreach ($va as $v){ echo "$v "; } echo ") "; } }Output Cluster 1: pioint 1: (1 2 ) pioint 2: (2 1 ) pioint 3: (2 3 ) pioint 4: (1 1 ) Cluster 2: pioint 5: (8 7 ) pioint 6: (8 6 ) pioint 7: (7 8 ) pioint 8: (8 6 ) pioint 9: (7 5 ) The following graph shows the original points.Two classes are show in the following graph